Steps to Design a Survey for Mindset Clustering
This project is part of the Resilient Media Project conduced by Gazzetta, funded by OTF, aiming to provide audience research insights for Chinese labor media.
0. Why do you need mindset segmentation?
You don’t need to design mindset questions in every survey. But it sounds very cool!
What is mindset clustering? In order to understand a person's mindset, one of the fastest ways is to ask binary questions and see where they landed in the spectrum. Each mindset question has two mutually exclusive statements, and there is no right or wrong answer. It is like an MBTI test, but the questions are designed for the research purpose we care about.

There are different ways to segment a certain community of people. You can use age, gender, race, education level, etc etc… But what if they have inherent characteristics that might be relevant to your audience research? Is it enough to ask one question in the survey, like “do you have risk preference”?
Our audience survey is designed for migrant workers in China, who work in big cities but have their "state identity" registered elsewhere. In order to research their information needs, we want to understand their mindsets for a unique segmentation, and connect it with demographic distribution.
1. Clustering into four groups is a good hypothesis.
Two dimensions can not only cover the entire territory, but also define it and make it a complete map. This is why there are necessarily four quarters to it, and there could not be three, or five. It is not an arbitrary number.

Four might not be the best choice in math for every sample.
In our case, four is not the best either according to the silhouette score of the KMeans method - 2 gets the highest score, while 4 and 5 follows.
However, splitting it in half seems too simple. And four is easier to explain than five.
Design mindset questions with this goal in mind: try to place the four clusters into the four quadrants evenly with some projection method. This will be the best way to interpret the clustering result.
You want a beautiful perfect map like the left chart. It’s okay to get a result that is not 100% perfect, like the chart on the right, especially when you want the axis to be actually meaningful…

2. Define the two dimensions first, and design questions according to it.
Define two dimensions first. They need to be completely different and not rely on each other.
For example:
Progressive vs Conservative
Communal vs Individualistic
Then brainstorm relevant elements:
Progressive vs Conservative (Adaptable, Growth & Change vs Unadaptable, Acceptance & Stability)
Communal vs Individualistic (Community-Connected, Connected, Future-focused vs Self-Reliant, Alienated, Present-focused)
The narrative statements begin to pop out:
Conservative vs Progressive:
Adaptable: Adapt quickly to new places
Stability: Prefer adventure and different ways of living
Acceptance: Strive for the rights I deserve
Individualistic vs Communal:
Emotionally-Connected: My friends make me feel warm and happy
Self-Reliant: Seek help from friends and colleagues
Future-focused: Planning and preparing for long-term goals
Purposeful: My life has hope, and I'm moving toward my goals

Then design your mindset questions accordingly.
It is recommended to distribute the questions evenly between the two dimensions from the beginning, so that the projection can reveal the most information. Compare these two charts. We want more coordinates like those in the right chart.

Fine-tune your model after getting the survey data. You may be surprised to find that a certain definition needs tweaking to get the best results. Most of the time, your hypothesis will still be valid and can provide a good guide for data analysis.
3. Organize the “direction” of your questions.
Try to design the questionnaire with positive answers on one side and negative answers on the other.
If it's too late for you to adjust, that's also fine. According to the math (try it yourself if you don't believe it), a mirror flip in one dimension does not affect the clustering results.
Mindset questions are often made up of two contradicted statements. Your questions will end up be like:
Please score 1-5 according to your heart, 1 is more A, 5 is more B. There is no correct answer.
Conservative vs Progressive:
Which statement do you agree with more?
A. Even after living in a new place for a long time, I still don't feel at home.
B. I adapt quickly to new places and immediately feel at home.
Which statement do you agree with more?
A. I prefer a stable life.
B. I prefer adventure and trying different ways of living.
Which statement do you agree with more?
A. All situations in life exist for a reason, I should view them with equanimity.
B. When encountering unreasonable situations, I should strive for the rights I deserve.
Individualistic vs Communal:
Which statement do you agree with more?
A. Life feels quite lonely, I'm just by myself.
B. My friends make me feel warm and happy.
Which statement do you agree with more?
A. I prefer to solve problems on my own, I don't like seeking help.
B. When I encounter problems, I seek help from friends and colleagues.
Which statement do you agree with more?
A. I focus more on current problems.
B. I prefer planning and preparing for long-term goals.
Which statement do you agree with more?
A. I feel lost in life, without goals.
B. My life has hope, and I'm moving toward my goals day by day.
And get a series of vectors like (3,4,5,1,2,3,4).
4. Weighted KMeans.
The distribution of age, gender, etc. in the survey will not be exactly the same with national census data. That’s why we need to do weighted KMeans in order to better reflect the actual demographic distribution.
However, I can’t find an existing python library for Weighted KMeans. But GPT can write the code for you. Make sure you understand every line before using it.

We do the weighting on age and gender.
The weight coefficient = National Census Data (2022) / Sample Distribution.
5. Do the clustering and find the best axis.
There are different ways to reduce dimensions and visualize high dimensional data.

We used PCA at first.
However, in order to explain the actual meaning of the two principal components, maybe simple projection would be better at it.
According to your hypothesis, your projection vector will look like:
X axis: (1,0,0,1,0,1,1)
Y axis: (0,1,1,0,1,0,0)
They need to be orthogonal (no two 1 at the same position). If two 0 appears at the same position, it means you decide to discard that question. Play around with the combinations if you will. For example, the left chart discarded 2 questions out of 7 (compare the projection vector of the y axis), thus less information can be shown.

For the scatter plot below, I group by each coordinate (x,y) on the plot, sum the weight of each dot for each cluster label, and show the color of the cluster that has the max sum at this coordinate. The size of the circle is also determined by the max sum.
Do we all agree that the right one is slightly better, because the clusters are more separated from each other, and it’s easier to draw (at least y) axis?

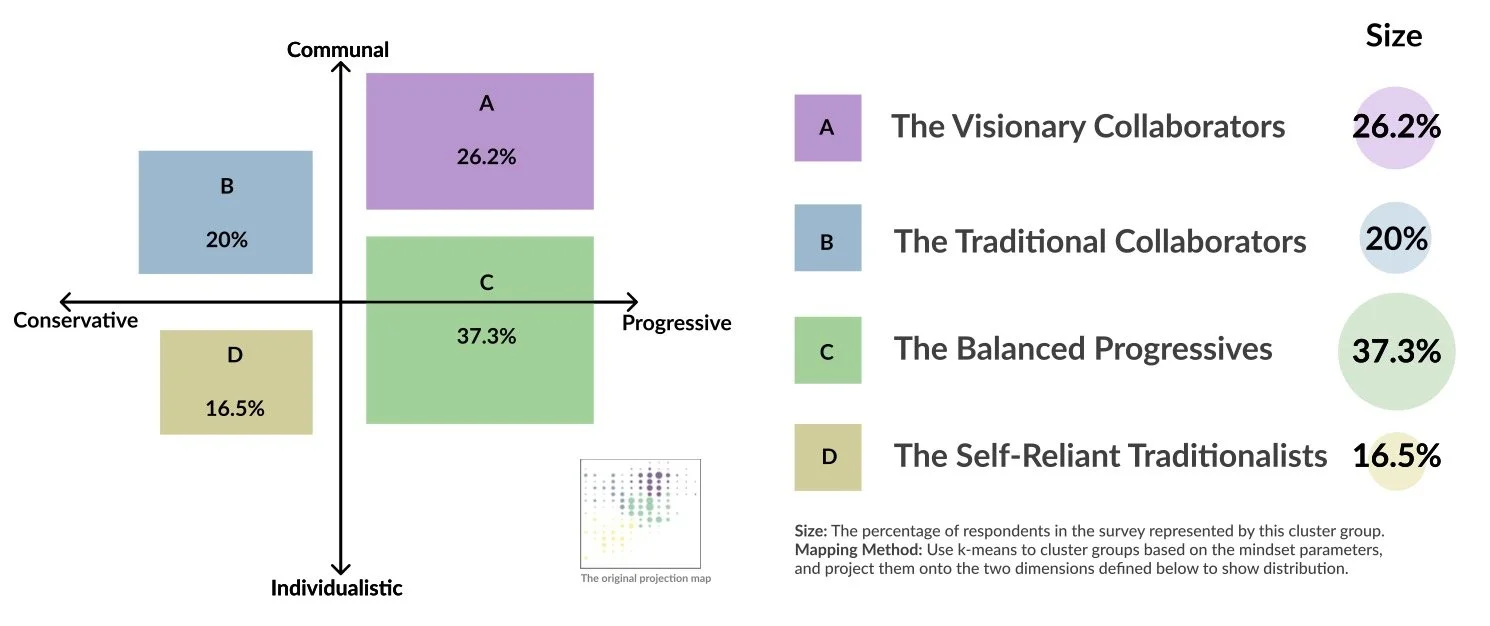
6. Abstract out your findings
Give each group a cute name, like The Conservative Homebody, The Risk-Taking Modernizer, The Cautious Networker, The Pragmatic Adapter… Like you are designing an MBTI test.
The percentage of each group gives important information. You don't want a group to be so large that clustering becomes meaningless.
And solid rectangles look firmer, don't they?

7. Understand the mindset clustering
Prepare an infinite amount of time to try to interpret the results using other survey questions...

*Hukou(户口) in Chinese means household registration.
“打工人” means “Worker”; “农民工“ is more like “Rural migrant worker”.